
 |
| முந்தைய படம் |
புதிய படம்  அருகிலிருந்து 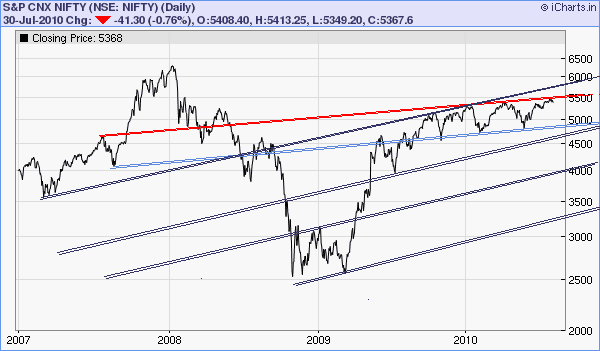 இன்னும் சற்று அருகில்  சந்தை,முதலீட்டாளர்களுக்கு வாய்ப்பு வழங்கும் என்று சொல்வதாக தெரிகிறது ... கவனமாக வணிகம் செய்ய வேண்டிய நேரமாக தெரிகிறது ... சிந்திப்போம் , நாம் பிறகு சந்திப்போம் ...நன்றி ! NIFTY OUTLOOK BY CHONA FINANCIAL SERVICES chennai Outlook: Nifty hits the final frontier of resistance :- Nifty hit the final frontier of resistance two weeks back and retreated forming a bearish evening star candlestick. The range between 5471 and 5570 is the final resistance zone that must hold for the bears to win the markets over the next few weeks. The bears had a bad time during the past weeks as prices kept grinding up forcing them to short cover, which along with bull interest pushed prices higher. There is a reason that 5471 to 5570, shown by the red lines in the chart, is treated as the final frontier of resistance. In December of 2007, the Nifty peaked near 6300 and lost nearly 2000 points. It rallied the next month to touch the 5471 to 5570 area and then began its great fall. This area which proved to be resistance was touched again two weeks back and acted as resistance. Also notice the formation of the evening star candle stick on at the peak two weeks back. An evening star has a long wick at the top and small body at the bottom, which is how the last candlestick on the Nifty chart looks. The evening star shows buyers rushing in after a rally in price in an attempt to push prices higher only to be met by a large supply of sellers, resulting in a drop in price. Evening stars identify an area where sellers exceed buyers. This should come as no surprise as the Nifty had fallen sharply in 2008 from the 5471 - 5570 area. Remember that the Nifty had a strong rally up from March 2009, which slowed down in October 2009. After October 2009 the Nifty moved into an uptrend channel, shown in the charts by the blue up sloping parallel lines. Notice that prices held between the blue lines during the uptrend. This uptrend was not as strong as the rally from March to October 2009 and has shown a series of sharp falls. In fact the falls in the uptrend have been faster than rallies, which is another indication of a weakening bull. In a clear uptrend, prices stay above the 50-day moving average and the average often acts as support. However, notice that since October 2009, the Nifty has moved above and below the average. This indicates a period of consolidation. Unfortunately a period of consolidation does not indicate future price direction. It does indicate a pause and introduces a possibility of prices reversals. The probability of reversal increases as the Nifty hit a resistance zone and formed a bearish evening star candle stick. Trading strategy :- Right now it makes no sense to go long given that prices have rallied up substantially. That leaves three options do nothing, take profits on long positions or go short. Taking profit is at least on part of the long positions is a no-brainer. Going short at resistance is the best area to take an entry as the profit potential is large and one can have a small stop loss. The profit targets on the Nifty would be 5365, 5253 and 5009. In case you don't trade the Nifty futures, look at stocks that are relatively weaker than the Nifty to short. A stock that has risen less in percentage terms than the Nifty from May 2010 till date is relatively weaker than the Nifty. Weaker stocks tend to fall faster than stronger stocks. Keep in mind that if the Nifty closes above 5570, the bear is in serious trouble. |

No comments:
Post a Comment